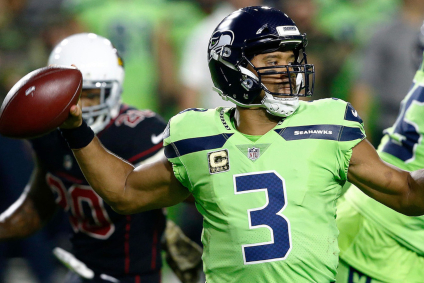
You know the old adage: Past performance does not always predict future success. When it comes to fantasy, what exactly do we mean by past performance? Well, almost anyone's initial fantasy projections and rankings for 2018 will start with looking at what kind of numbers that player posted in 2017. That is why, for example, Russell Wilson is often (even on these pages) ranked as a top 3 -- or even the #1 -- fantasy QB for this coming season -- he was the top fantasy QB of 2017.
But it isn't enough to suggest that he was the top fantasy QB in 2017 because he scored the most fantasy points (which he did). In standard scoring format (4 points per passing TD, 6 points per rushing TD, 1 point per 25 yards passing, 1 point per 10 yards rushing, and -2 for interceptions or fumbles) Wilson scored a hair under 350 fantasy points. The second-ranked QB (Cam Newton) scored approximately 50 fewer fantasy points on the season. That is a nearly 15% difference.
But do those numbers tell the whole story?
I always caution folks when looking back at a single season's worth of data to avoid the temptation to overrate a season's overall production. After all, if a player competed in all 16 games and another did not (due to injury or being sat for a meaningless Week 17 contest, for example) then we are not talking apples-to-apples. In Wilson's case, his average weekly score (21.97) was in line with his seasonal output, as he ranked #2 among fantasy QBs in average weekly output -- bested only by DeShaun Watson, who participation in so few games makes his sample size questionable.
The drawback to looking at average weekly scores is that often times one or two outliers can significantly alter the week-by-week picture of how well a fantasy player performed. Remember, you win your league by outscoring your opponents on a week-by-week basis -- not based on a seasonal scoring total. For, example, let's say that a player put up this sort of production over a 4-game stretch: 11 points, 10 points, 40 points, 11 points. In that scenario, his average turns out to be 18 points; however, that is not a great predictor, since he posted one score (40), which appeared to be an anomaly. Otherwise, he scored 10-11 points each week. Having such a player on your fantasy team may have very well put you in a 1-3 hole, depending upon how well the rest of your fantasy team did each week. Moreover, the QB who averaged 18 fantasy points per game last year (Kirk Cousins) ranked as our #7 fantasy QB, while the QB who averaged 10-11 points per game (Brock Osweiler) ranked 36th. That is a BIG difference.
To get close to that reality, I prefer looking at the median over the average. In our example above, the median (or middle) value lies between 10 and 11: 10.5, which gets us to the more accurate predictor. Again, looking at Russell Wilson, his median value was 22.71 fantasy points, which tells us that he scored 22 or more fantasy points in half or more of his contests. This was 2nd to Carson Wentz, who led the way with a median value of 23.38. Of course, Wentz saw his season cut short with the knee injury. The next best fantasy QB (Aaron Rodgers) had a median of 21.9. The minimal variance between Wilson's median and average tells us that he was not only very prolific --
but also very consistent. That is, he did not have very many BAD games that would have driven down his average. Sure enough, taking a closer look we can see that there were just 2 contests last year where he failed to score 15 fantasy points.
Another key for me is: how many times did the player post studly numbers last season. That is, how many times was he a top 5 performer at his position?
Again, using Russell Wilson as our barometer, he finished as a top 5 fantasy QB ten (10) times -- most among fantasy QBs -- in 2017. That is in accordance with our median calculation, where we saw that he scored at least 22 fantasy points in more than half of his contests.
From a consistency standpoint, I also like to evaluate how often would the player have been a justifiable start at his position. To calculate that, you take a look at how many teams are in your league. Then figure out how many times the player finished in top number of teams. So, for example, if you have 12 teams in your league, you would want to see how many times the player finished as a top 12 player at his position.
Russell Wilson finished as a top 12 fantasy QB 12 times in 2017. Again, that is consistent with what we saw above, when we identified that he had a handful of games where he scored fewer than 15 fantasy points. What's more, these 12 times in which Wilson finished as a fantasy QB1 ranks him SECOND (behind Tom Brady) in the overall picture.
For positions that require more than one starter (say, 2 RBs 3 WRs) you would want to look at how often the player finished in each tier. So, in a 12-team league you would do as we did above to see how often the player finished in the top 12 to gauge how often they finished as a RB1 or WR1. Then look at the top 24 (2 x 12) to see how often then finished as a RB2 or WR2. Then, finally, look at the top 36 (3 x 12) to see how often they finished as a WR3.
When combining, ALL of these factors together, we get a very representative picture of how each player ranked by position in 2017. That then provides us with a great summary for 2017 -- and a wonderful starting point for ranking the players for 2018.
All of the above is neatly condensed and summarized here: Summarized Rankings from 2017.